This article is a technical narrative of how our three-person team built and reshaped a data platform for our business using Microsoft Fabric. The goal is to document what we built, why we made the decisions we did, how we operate, and how we went from PoCs to running Fabric "in production."
My intent is to go a bit deeper than a standard implementation blogpost & share as much useful info as possible for other data teams working in or considering Fabric. This is our full manifesto with design decisions, setbacks...everything. This is the article I would have wanted to read 18 months ago.
# Part 1 - Business context
![[Pasted image 20260530151910.png]]
>*A visual timeline of our Power BI and Fabric journey, starting mid-2019 as usage became widespread*
We'll start our journey five years before Fabric even entered public preview, and four years before my team even existed. Around 2018, business users began adopting Power BI Desktop independently, but they couldn’t reliably connect to core systems, ERP, plant databases, or really anything aside from Excel. Early wins came from simply getting reports refreshing automatically a few times per day instead of relying on humans. Replacing a manual Excel source with a direct refresh of shift reporting from our DB2 ERP system? It was magical.
To understand the rest of this story, it helps to provide some organizational context. AGC is a global company with highly varied businesses: automotive and architectural glass, electronics, ceramics, chemicals, advanced materials, and more. It is also highly federated. Different regions and business units have significant autonomy, which is empowering in some ways and inefficient in others. Standards emerge slowly. Duplication of effort is everywhere. At various times I may refer to "centrally" managed solutions. When I do so, I am referring to central management *within a business unit*. At the global level, we are federated.
The platform I outline in this article serves a single business unit: AGC Automotive North America ("AANA"). We manufacture glass for automotive applications across the United States and Mexico. We have roughly 3,000 employees, a corporate office, a research and development center, and multiple manufacturing plants. As of June 2026, around 600 users actively interact with the data platform, 300 do so weekly, and 150 do so daily. Many others consume platform data indirectly through plant-floor signage, printed reports, and via "reverse ETL" integrations with operational systems. Your mental model of our organization should be mid-market.
Formally, our team has existed since 2022 as the **Analytics Team** and we sit within the IT organization (although we work hand-in-hand with our business domains). In practice we function as the central data platform team for the AANA business unit: responsible for data integration, transformation, semantic modeling, and the creation of key enterprise reports that the business runs on.
In 2019, a greenfield ERP implementation was underway from various legacy systems, both DB2 and SQL Server based. We had selected SAP S4/HANA for our next-generation ERP, but what should be the official analytics stack?
There were several theoretical answers:
1. Let the business solve its own reporting needs. IT stays out of reporting and supports the bare minimum.
2. Adoption of a heavy "enterprise" solution like SAP Analytics Cloud (at the time).
3. Choose a modern PaaS/SaaS "data stack."
We intentionally chose Power BI as our official analytics stack rather than entering the ever-changing world of SAP business intelligence. A foundational move was purchasing Premium capacity early, so usage, adoption, and development could scale without the overhead of per-user licensing.
That decision was driven by a sense of "where the wind was blowing" with regards to Power BI. Even in 2019, it was obviously ascendant. In the context of our business, with more IT resources and training going to Azure - it was a strong choice. When Arun Ulag states the core customer persona for Fabric is a technical leader asking for unification - to reject the title of Chief Integration Officer - that's us. We want to create data products & tools for the business. Not debate the finer points of cloud networking and infrastructure.
>*"When I talk to customers, the message I consistently get is, please unify, I'm Chief Information Officer, I don't want to be the Chief Integration Officer."*
>*- Arun Ulag*
So years later in 2023, Fabric was a logical next step. We were already invested in Power BI Premium. We already had Azure knowledge in the team. We already had pieces of Azure SQL Database, Synapse, and pipelines in place. We didn’t need a platform that maximized optionality across. We preferred reduced integration overhead, a predictable bill, and let us spend time on business logic instead of platform glue.
Other AGC regions do use platforms such as Snowflake and Databricks, and all of them use Power BI to some degree. So the question was not which platform was viable, since all of them clearly are. As a small team, we cannot afford to spend our time translating between disconnected tools, or creating new infrastructure for each project. We needed a platform that reduced integration overhead, simplified cost management, and let us focus on business outcomes instead of babysitting the technology stack.
## Why Premium capacity?
One of the early decisions we made which set us up for Fabric, came three years before Fabric was even in public preview. After much deliberation, we bought a P1 capacity very early on - before we had the usage metrics to support it. This was a strategic decision:
1. It gas us a simple licensing story. One capacity, and Pro licenses for developers only. Even the seemingly minor overhead of juggling individual BI licenses has a chilling effect on adoption. People become reluctant to share content. They become frustrated when they are unable to click a link someone shared, or when licenses aren't granted immediately. They quietly rely on specific individuals to pull reports manually and share them with wider audiences. These are anti-patterns.
2. It gave us a fixed cost model. We have compute to allocate and optimize as we choose, with predictable spend. For all the complaints about the capacity model (and I totally understand why many customers demand serverless) it remains perfect for our organization.
3. A path to rapidly expand as we rolled out enterprise reporting from SAP and quickly scaled from 30 users to 300.
A capacity-based model changes how an organization thinks about access. When authorized users can access content without thinking about licensing, adoption is smoother.
And of course, in 2023 when Fabric became available, our Premium capacity effectively became usable for Fabric overnight, letting us extend beyond BI into lakehouse and data engineering workloads with no change in billing (at least, not then). This point can't be understated - as a Premium user with spare capacity on our P SKU, Fabric **effectively gave us the entirety of the Azure Data stack to run on the same annual bill**.
In concrete terms, the platform described in this article runs on **one reserved F64-equivalent capacity for roughly $5,000 per month**. That cost envelope is one of the main reasons this architecture made sense for us. For a small central team, being able to deliver enterprise BI, lakehouse engineering, SQL databases, orchestration, mirroring, and broad internal report distribution on one predictable reserved-capacity bill is a very strong value proposition.
> [!NOTE]
> Our single P1 capacity (now F64) can comfortably handle terabytes of Open Mirroring ingestion, multiple Fabric SQL databases, lakehouses, hundreds of scheduled pipelines and notebooks, and 600 monthly active Power BI users hitting a few well-designed semantic models.
That said, capacity is not a solved problem just because the bill is predictable. Reserved capacity has been both a blessing and a curse. On the plus side, fixed spend makes leadership conversations easy and lowers the friction of experimentation. On the minus side, achieving workload isolation can require grossly overpaying for compute you don't need.
The common guidance to isolate and split capacities is tone-deaf. At the F64 and historical P1 tier, one of the key benefits is the ability to distribute reports without per-user Pro licensing. What if an F64 is the right amount of compute for your org, but you need to split into smaller capacities for isolation between production and development workloads, or between managed and self-service? You still lose free report distribution, even if the total amount of capacity your organization pays for is equal to or greater than an F64. So the theoretically cleaner architecture of separating BI, engineering, dev, test, and sandbox workloads often collides with the licensing model.
Yes, we have new capabilities like workspace surge protection and designating mission-critical workspaces. These are helpful, but they only throttle additional jobs after a % limit is reached, they don't prevent a developer or business user from killing your capacity with one runaway job. So in practice we will either need to keep Fabric access locked down behind significant onboarding and terms-of-use training, or we need to grossly overpay for capacity to achieve true workload isolation without giving up free-user report distribution. All of this means capacity management becomes a governance problem. If you give teams free reign to create Fabric artifacts, you are also giving them the ability to consume shared compute. A bad notebook, an expensive interactive query, or even a platform bug can affect everyone. We have lived through that.
## Starting with the Fabric adoption roadmap
The vision for a data platform team is not “build reports." It is to increase enterprise-wide common metrics, increase business ownership of KPI definitions and master data, build broad capability across multiple levels, and decrease manual reporting and “asking and waiting.” If a senior leader can view month-to-date sales just as quickly and easily as an analyst can drill into product cost detail, then we have done our job. The [Fabric adoption roadmap](https://learn.microsoft.com/en-us/power-bi/guidance/fabric-adoption-roadmap) calls out executive sponsorship as a distinct pillar because adoption requires authority across boundaries: policy, prioritization, funding, and conflict resolution. AANA’s direction is **managed self-service** at its core. Our central team builds and curates core data assets, while business teams create reports and analysis on top. The well-known phrase “discipline at the core, flexibility at the edge” is our north star.

> *The Microsoft usage scenario for "managed self-service" BI in Fabric.*
Our team operates as a product and enablement function.
1. We build and run the data platform
- We integrate source systems and standardize data in a lakehouse architecture, and publish reusable tables, semantic models, reports, data-driven alerts, and integrations back to operations systems.
2. We deliver a small number of high-ROI enterprise solutions end-to-end.
- We prioritize work tied to strategic cross-functional outcomes (manufacturing performance, S&OP, margin analysis).
3. We enable an increasing number of business analysts to build on top.
- We do this through training, documentation, patterns/templates, and co-development. The goal is to enable individuals, teams, and departments to service their own needs where possible.
4. We use governance as guardrails.
- A governance program is successful to the extent that the organization avoids siloed solutions, reduces technical debt, and ultimately owns and manages its data in a consistent and transparent fashion.
- We monitor platform usage through a custom reporting solution using key Power BI / Fabric APIs
- [Metadata scanning overview - Microsoft Fabric | Microsoft Learn](https://learn.microsoft.com/en-us/fabric/governance/metadata-scanning-overview)
- [Admin - Get Activity Events - REST API (Power BI Power BI REST APIs) | Microsoft Learn](https://learn.microsoft.com/en-us/rest/api/power-bi/admin/get-activity-events)
This operating model only works if the central team can genuinely work end-to-end. On a team of our size, there is no room for rigid specialization on engineering, visualization, etc. Each member must be able to take a use case from source integration through transformation, semantic modeling, and delivery. Fabric was attractive in part because it makes that full-stack expectation more realistic.
Managed self-service also needs a people model. We have a simple three-step framework for reasoning about data enablement in our organization:
1. Level 1 means a person can use modern data tools correctly in the context of their job. That could be a report, a connected Excel workbook, an AI agent, or any other tool.
2. Level 2 are domain experts who can create new data products or perform deep analysis using governed published data. They can also train Level 1 persons within their domain. These are the analysts the central team knows by name and actively supports.
3. Level 3 means a person can create and sustain data products with enterprise-level best practices: devops, reuse, training, and the ability to raise the capability of others.
The goal is not for everyone to be a data engineer. The goal is for everyone to be fluent at the right level, and for the platform team to act as the center of gravity for the analysts extending what we publish.
![[Pasted image 20260605092114.png]]
>*AANA Power BI usage metrics Jul’25 - Jun’26*
## The floodgates
The moment your work starts succeeding, your team will be *supply-constrained*. This is a good problem to have, but it's still a problem.
- More stakeholders want enterprise KPIs.
- More teams want local reports.
- More projects want data integration help.
- With hundreds of users and scheduled tasks, the overhead of "quick questions", "can you call me" chats, and 1% job failure rates demands a significant portion of the central team's capacity.
You can do good technical work and still fail without a clear model for deciding what gets attention. In our case, we needed:
1. A monthly cadence to review top priorities with senior leadership.
2. Clear connection between data initiatives and business goals.
3. Clear data ownership within business domains.
4. To become skilled at saying "no." Or at least, "not yet."
This is also where the workload reality shows up. A business-facing data team can accidentally make the business forget how much engineering work sits underneath the experience. That is a compliment and a risk. People will happily ask for the next dashboard, pipeline, or data product without thinking much about naming conventions, orchestration, testing, CI/CD, observability, or technical debt. But none of those become optional just because the business isn't asking for them by name.
In practice, we've had to work in cycles. Some periods are about delivering a minimum viable product quickly because the business genuinely needs a tool now. Other periods must be about paying down technical debt, standardizing, and improving the platform itself. If you only do the first, any system eventually becomes expensive, brittle, and slow to change.
> *"Just make it exist first, you can make it good later."*
Technical architecture decisions must consider organizational environment, the maturity of the development team, and allow business leadership to focus and prioritize.
## Why no global data platform?
One common question in a company this large: why there is no single AGC-wide data platform? The short answer is that global platforms are in the works, but they require years of effort, deep international collaboration, and a strong support model.
Standardization is not absent, but it's partial and uneven. M365, identity, security, ERP, and collaboration tooling are converging over time, but regional business units still need to solve their own local problems. In that environment, regional platforms persist. Our job is therefore narrower and more practical: serve our business unit well, remain interoperable, and avoid designing around hypothetical future global architectures that do not yet exist.
So far, that has also meant very little true cross-region data sharing inside Fabric. We are not shortcutting directly across AGC regions or business units today because the prerequisite is that the other regions are also in Fabric, and many are not. We look forward to this changing in the future. If other regions exposes data through Snowflake, Databricks, or Fabric, then shortcuts, mirroring, and shared semantic models become possible. For now these are future possibilities and not a major consideration in our design.
## Learnings
For a small BI team, your data platform architecture just might determine how well you sleep at night. Design with some principles in mind:
- Architecture decisions are downstream from organizational structure.
- Your billing model shapes adoption.
- Data ownership matters, and the owner isn't the BI team.
- For central teams: support, prioritization, and SLAs are primary concerns.
So in early 2026, where have we landed? At the global level, with over 50,000 employees, you could say the AGC Group is an unintentional data mesh. But for our single business unit, with 3,000 employees on one continent and a 3-person platform team, have an operating model that gives us leverage. Less of a mesh, and more of a hub.
But only a year ago, we were struggling with Fabric. Too many workspaces, lack of centralized monitoring, flaky Dataflow Gen2s, unpredictable capacity usage, and an incomplete CI/CD story.
A lot has changed in a year.
# Part 2 - Enter the Hub
In 2025 we recognized that although we were having initial success using Fabric in production for individual projects, we did not have the proper architecture to continue scaling. Far too many workspaces, no consistent standards for code and *which* Fabric artifacts to use, and auditing/logging being implemented per-project instead of platform-wide. As one of our senior engineers put it, Fabric was beginning to have "shit everywhere." Our federated workspace structure (which served us well when working with only Power BI and Dataflow Gen1) was no longer serving us. Did we really need to segment workspaces into source-aligned and consumer-aligned data products? Could we do something cleaner without building an unusable monolith?
The answer turned out to be yes, but only after we started thinking differently. At the global AGC level, a decentralized landscape is inevitable. Different regions have different systems, priorities, teams, and budgets. But at the level of a three-person platform team serving one business unit, over-federation was actively harming us.
This was one of the biggest design changes we made. Early on, we leaned too far toward a mesh-like interpretation of Fabric: many workspaces, project-aligned ownership, local orchestration, local logging, and local patterns. In practice, this caused drift, boilerplate code, made monitoring harder, and slowed us down. We were solving for hypothetical futures.
The hub model was our solution. Centralize the common platform functions. Centralize monitoring. Centralize orchestration. Centralize the reusable lakehouse layers. Keep enough internal modularity that a package can be separated later if truly required, but do not pay the cost of that separation before it is needed.
So, we set out on a project to reorganize our Fabric environment and build a stronger foundation.
## Pillars of the "AANA Hub"
1. Provide standard, governed, and tested foundations for all AANA analytics projects, including centralized orchestration, auditing, and monitoring.
2. Provide a central set of schema-enabled lakehouses, serving as the source for all enterprise semantic models.
3. Reduce the total number of workspaces and artifacts in our Fabric environment through configuration and metadata-driven approaches.
4. Provide a common way-of-working and development cycle, allowing more time to be spent on value-add activities.
5. Avoid teams or developers creating independent, redundant solutions to common problems.
6. Allow data projects to focus on business requirements, removing the need to redevelop boilerplate code for basic functionality.
## Workspace design
We've had dozens of Power BI workspaces created since 2020, consisting of either centrally or business-managed workspaces with a simple naming convention:
```
<Business unit> - <Optional domain> - <Subject> [<Environment>]
```
![[Pasted image 20260607162805.png]]
>*A small sample of pre-Hub workspaces. These examples are representative, not exhaustive.*
Business managed workspaces are indicated by a "Shared" suffix. Every workspace must have a contact who is accountable for the content within. This is our key individual to contact in case governance guardrails are violated. Think excessive capacity usage or duplication of existing data products (i.e. redefining sales outside of the central semantic model)
When starting with Fabric in 2023, we initially mirrored the shape of our existing Power BI estate. We had domain-aligned workspaces that mapped neatly to classic workspace apps and business subjects like Sales, Operations, Supply Chain, and Profitability. Our first instinct was to preserve that pattern for consumption while introducing new Fabric workspaces aligned to source systems and platform responsibilities.
On paper, that looked sensible. Source-aligned workspaces promised clean ownership boundaries for engineering, while consumer-aligned workspaces seemed like the natural place for semantic models, reports, and app distribution. In practice, it created too many moving parts. Every new boundary multiplied across Dev, Test, and Prod. A clean conceptual split very quickly became extra deployment pipelines, extra bindings, extra access reviews, extra monitoring surfaces, and extra chances to break otherwise simple changes.
We then moved to a more explicit five-workspace Hub design per environment:
![[Pasted image 20260607162922.png]]
That model was a meaningful improvement. It gave us clearer separation between orchestration, engineering assets, ingestion, storage, and business-serving artifacts. It also helped us reason about where new item types should live as Fabric matured. But even then, we felt the division of workspaces was a bit too granular for our needs The next step was a two-workspace model per environment:
![[Pasted image 20260607163310.png]]
Does this seem familiar? That's because everything old is new again:
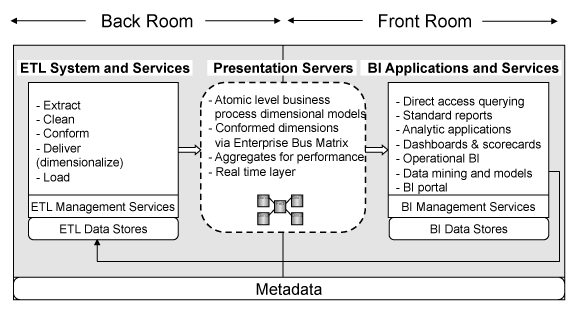
Our workspace design basically resembles Kimball's Back Room versus Front Room distinction. Our Core workspace is the back room. It contains the engineering, ingestinon, orchestration, and storage: lakehouses, mirrored landing zones, notebooks, pipelines, SQL databases, metadata tables, and the artifacts that make the platform run. Our Analytics workspace is the front room. It contains the business-facing layer: semantic models, reports, dashboards, and organizational apps.
This split proved to be the right level of abstraction for us. It also aligns with how we actually work. Our team is full-stack. The same engineers who build ingestion and transformation patterns also support deployments, monitor refreshes, tune models, and develop reports. Treating the whole platform as a coordinated unit reduced overhead with very little downside.
1. CI/CD became more tractable.
2. Monitoring became centralized.
3. Standards became enforceable.
4. New developers can reason about the environment.
5. High-value fixes benefit many workloads at once.
As we realized, the more we split a single solution across multiple workspaces, the more the platform taxed us in day-to-day operations.
Some of that tax comes from hard platform boundaries. Certain experiences still work best, or only work at all, when related items live together. Variable Libraries, certain notebook functions (T-SQL), task flows, workspace monitoring, lineage, and other capabilities work best within a workspace. Some of it is a "soft" tax on the developer experience: more navigation, more deployment sequencing, more cross-workspace dependency management, and more chances to lose the plot during routine development and support.
That was the core conclusion of a [separate article](https://aboerg.dev/Posts/2026/The+case+for+fewer+workspaces+in+your+Fabric+solution) I wrote on the subject: for a small central platform team, fewer workspaces should be the default. If one project is split across five workspaces and three environments, the team is effectively juggling fifteen containers before considering shortcuts, multiple deployment pipelines, monitoring configuration, or artifact bindings. That complexity rarely pays off unless there is a concrete access boundary being enforced.
Report distribution is the other half of the workspace-design problem. For years, classic Power BI workspace apps required a one-workspace-to-one-app pattern, because each workspace could publish only one app, even if you could tailor visibility with audiences ([Create and distribute apps in Power BI](https://learn.microsoft.com/en-us/power-bi/collaborate-share/service-create-distribute-apps)). That meant our workspace design was also driven by the number of apps we needed, not what was actually cleanest for development and CI/CD.
The introduction of org apps changes the equation. Fabric now supports multiple org app items per workspace, and those org apps can package reports and automatically propagate access to included items and related semantic models ([Get started with org apps](https://learn.microsoft.com/en-us/power-bi/explore-reports/org-app-items)). This is a much better fit for our target state. It means one Analytics workspace can hold all the business-facing artifacts managed by our central team, while still allowing us to publish multiple curated consumer experiences for different audiences without cloning reports or spinning up extra workspaces to match the app structure.
Org apps are still maturing, but the gaps are closing rapidly. Once org apps go GA, the need for carving the reporting layer into many separate workspaces weakens considerably.
There are still legitimate reasons to split workspaces. Different teams may own different domains. Different capacities may be needed for workload isolation. Different workspace-level security models, Private Link requirements, or feature settings may apply. A workspace may also need to stay below artifact count limits, or soft limits like Fabric deployment pipeline performance.
Our rule is simple: if a workspace split does not achieve something *we cannot achieve any other way*, we should not create it. For us the benefits of centralization outweigh the negatives. Over-segmentation itself can become a source of mistakes.
The broader principle is not to design for organizational futures that aren't in the business plan. If a source domain, region, or project genuinely needs to be split later, it's easier to carve out a well-structured monolith than to wrangle workspace spaghetti.
### Design tools
One tool that helped during this phase was the note-taking app Obsidian. Over time our "lakehouse design" canvas view turned into a completely unhinged-looking wall of notes, screenshots, Reddit comments, Microsoft diagrams, internal architecture slides, and arrows pointing in every direction.
This messy canvas was where we argued about workspace boundaries, medallion layers, landing versus bronze responsibilities, Gold design, and what should live where. You could absolutely do the same thing with Excalidraw, Miro, Lucidchart, OneNote, or a physical whiteboard.
![[aana hub lakehouse design diagram 2026-06-07 124358.png]]
>*A small portion of the design canvas. Notice how many of the nodes are simply Reddit comments from r/MicrosoftFabric and r/dataengineering.*
## Team skillset
Before getting into zoning, two common questions:
1. Why lakehouses instead of warehouses?
2. How much of this design was driven by the team's skills?
For us, the answer to both is the same: start from the engine. When we began, Warehouse did not yet have some capabilities we considered basic for our use cases, particularly lack of `MERGE`. More importantly, we already knew we wanted structured streaming, full access to the capabilities of OSS Delta Lake, and metadata-driven idempotent processing that could be expressed in both SQL and Python.
We considered Spark the more complete engine. We did not need multi-table transactions badly enough to accept the newer and incomplete T-SQL surface area of the Warehouse. We did need mature batch and incremental patterns, focus on OSS Delta Lake capabilities, and the freedom to solve ETL problems without waiting for the platform to catch up. A chronically helpful Microsoft software engineer on the SQL Sever Telemetry team, Raki Rahman, summarized this viewpoint on the Microsoft Fabric subreddit:
>[*Spark lets you solve any ETL business problems this afternoon*.](https://www.reddit.com/r/MicrosoftFabric/comments/1nj45nz/comment/nep16yj/?utm_source=share&utm_medium=web3x&utm_name=web3xcss&utm_term=1&utm_content=share_button)
Check out the SQL Server Telemetry team's Fabric implementation [here](https://community.fabric.microsoft.com/t5/Fabric-Updates-Blog/SQL-Telemetry-amp-Intelligence-How-we-built-a-Petabyte-scale/ba-p/5172403).
As far as our team, we came in with a mix of SQL, Python, .NET, and DB2-oriented data experience. The common denominators we chose to focus on were SQL and Python. That made a lakehouse-centric approach more natural. Over time, it has also pushed us toward a more software-engineering-centric development model: thinner notebooks, more shared Python code, more VS Code, more reusable packages in our shared wheel.
[Notebooks, Spark Jobs, and the Hidden Cost of Convenience | Miles Cole](https://milescole.dev/data-engineering/2026/02/04/Notebooks-vs-Spark-Jobs-in-Production.html)
None of this is a slight against the Warehouse, which has come a long way in the last 18 months and should absolutely be considered if your team leans heavily into T-SQL or you need multi-table transaction support.
## Lakehouse zoning
### A note on medallion architecture
As we've all heard from the marketing, "medallion architecture" refers to the concept of processing data in multiple layers, with the tasks occurring at each layer being defined up-front. There is not universal agreement on what happens at each layer, and organizations will inevitably perform different tasks at different layers. Some have taken this to mean that we should instead name our layers using terms like "raw", "enriched", "base", "curated" and so on. In my view this does not remove the need to explain the context and purpose of each layer. I don't instantly know what your organization means by "base" or "ODS" any more than I know what you mean by "silver." Your data storage & processing architecture will never be self-explanatory from a single word, and medallion has the minor advantage of being intelligible to the business.
Even though a single unified "medallion architecture" doesn't really exist, I'm not opposed to the term as shorthand to describe how data is processed for analytics. Everyone can instantly understand the implication of taking data from a "bronze" state to a "gold" state. That said, no matter what we name our layers, we _still need to document what we are doing at each layer._ No one-word description of a layer can possibly be self-explanatory, whether we choose to call it "base" or "silver."
What the medallion detractors get correct is that 3 layers are _not_ mandatory, and may be overengineering depending on the scale of the project and the type/number of source systems being integrated. Medallion makes sense when building an entire greenfield data platform for your organization (as we are). Medallion does not make sense when you are a domain analyst connecting to enterprise data sources and require minor transforms prior to reporting. If you find yourself with a layer in your architecture that doesn't serve an obvious purpose, think harder. Constantly I read posts from Fabric newcomers thinking that they need a full Medallion when one Copy Job, a few tables in a Lakehouse, and one semantic model are perfectly sufficient for their goals.
And of course, medallion tells us nothing about your data modelling strategy. Kimball? 3NF? Data vault? None of these are mutually exclusive with medallion, despite what mindless comparisons on LinkedIn say about the "pros and cons" of each "architecture."
Our zoning design took weeks of thought, reading, trial, and discussion to settle on something that felt production-worthy. That may sound excessive until you start listing the decisions hidden behind a cheerful bronze-silver-gold diagram.
Where does raw data really stop and standardized data begin? Do you need a distinct landing zone in Bronze? When do you convert to Delta? Which layers are immutable? Where do you historicize? How do you partition for full loads versus incremental loads? At what layer do you provide the current state of your source-systems? When do you start joining? Do you have a "business modelling" layer, or do you go directly from sources to requirements? These questions are foundational to your design, and the marketing material is not enough to answer them. We leaned heavily on broader Delta Lake, Spark, and enterprise Databricks design patterns, as well as countless discussions with on the Fabric subreddit.
This is a complex topic. Here are a few resources that helped us on our way:
- This azure data lake [zoning diagram]((https://i.imgur.com/3QobHaf.png) from Simon Nuss
- The [medallion design](https://github.com/edkreuk/FMD_FRAMEWORK/wiki/Medallion-architecture) of the FMD Framework
Our Lakehouse zoning implementation:
![[Pasted image 20260530165603.png]]
- Three schema-enabled "Hub" lakehouses within the "Core" workspace, each lakehouse corresponding to a medallion layer.
- Landing and Bronze zones use the Files and Tables section of a single "Bronze" lakehouse, respectively.
- Silver & Gold are individual lakehouses which use only Delta Lake format within the Tables section exclusively.
- Shortcuts and mirroring may be used to ingest data to Bronze, in addition to batch processes.
- Shortcuts enable use of Silver or Gold data in ad-hoc Sandbox workspaces.
- Streaming data from Real-Time intelligence is processed in a dedicated workspace, but Eventhouse tables are replicated to OneLake in the corresponding lakehouse layer.
| Property | Landing | Bronze | Silver | Gold | Sandbox |
| ----------------- | ----------------------------------------------- | ----------------------------------------------------------------------------------- | -------------------------------------------------------------------------------- | ------------------------------------------------------------------------------------------ | ----------------------------------------------------------------------------------------- |
| Naming convention | LH_AANA_Hub_01_Bronze | LH_AANA_Hub_01_Bronze | LH_AANA_Hub_02_Silver | LH_AANA_Hub_03_Gold | Multiple |
| Purpose | Raw, partitioned storage in native file formats | Append-only ingestion, populated from landing zone using Spark Structured Streaming | Data which is filtered, cleaned, standardized, quality checked, and historicized | Data which is modeled, joined, aggregated, and ready for consumption by nontechnical users | Exploratory analysis |
| File format | Any - parquet, CSV, JSON, JPEG, etc. | Delta | Delta | Delta | Table or schema shortcuts from Hub workspaces Any - Delta, parquet, CSV, JSON, JPEG, etc. |
| Velocity | Real time, batch | Real time, batch | Real time, batch | Real time, batch | Batch |
| Validation | Unvalidated | Schema applied | Filters, data type changes, tests, and standards applied | Business logic and modeling techniques (star schema or OBT) applied | Unvalidated |
| Mutability | Immutable (Read-Only) | Immutable (Read-Only) | Mutable (Read-Write) | Mutable (Read-Write) | Mutable (Read-Write) |
| Data type | Structured, semi-structured, or unstructured | Structured, semi-structured, or unstructured | Structured | Structured | Structured, semi-structured, or unstructured |
| Persona | Data Engineer | Data Engineer | Data Engineer, Data Scientist, Data Analyst | Data Engineer, Data Scientist, Data Analyst, Business User | Data Engineer, Data Scientist, Data Analyst, Business User |
| CI/CD | Mandatory Git | Mandatory (Git) | Mandatory (Git) | Mandatory (Git) | Optional |
### Shared Spark configuration baseline
Across Bronze, Silver, and Gold, we keep a shared Spark baseline aligned to Microsoft's guidance on [Delta table maintenance in Microsoft Fabric](https://learn.microsoft.com/en-us/fabric/data-engineering/delta-lake-table-maintenance?tabs=sparksql). When using lakehouses, it’s our responsibility to keep Delta tables healthy with autocompaction, explicit parquet datetime behavior, and optimal filesizes. This baseline complements, but does not replace, regular maintenance tasks such as `OPTIMIZE` and `VACUUM`.
A sample of our shared Spark configurations:
```python
# Explicit parquet datetime handling
spark.conf.set("spark.sql.parquet.int96RebaseModeInRead", "CORRECTED")
spark.conf.set("spark.sql.parquet.int96RebaseModeInWrite", "CORRECTED")
spark.conf.set("spark.sql.parquet.datetimeRebaseModeInRead", "CORRECTED")
spark.conf.set("spark.sql.parquet.datetimeRebaseModeInWrite", "CORRECTED")
# Auto compaction keeps small files under control between scheduled maintenance operations
spark.conf.set("spark.databricks.delta.autoCompact.enabled", "true")
# Reduce Delta snapshot overhead when Spark identifies the active files in a table version
spark.conf.set("spark.microsoft.delta.snapshot.driverMode.enabled", "true")
```
### Landing
_Purpose:_ Decouple from source, preserve original formats, and rebuild downstream layers on-demand.
The landing zone is where all data from external source systems is landed. Flat files are stored in directories partitioned by ingestion time, ingestion type, and a unique load key (`lineage_key`).
This layer decouples direct ingestion from the source system into the bronze layer, providing additional control for pulling the data into bronze based on a particular time schedule or a particular event (e.g. only load if a group of files arrive). It provides a buffer in the event of any intermittent failure or incorrect data being sent from the source system. It also facilitates reprocessing into bronze when necessary.
The landing zone plays an important role when:
- Responsibility of sending data belongs to source systems (i.e. an external client is pushing data to OneLake, instead of Fabric pulling the data into OneLake via a notebook or pipeline).
- Data is ingested in semi-structured or highly nested formats using a REST API, and more than one schema could be applied to the same data.
- Data is encrypted, zipped, or otherwise needs preprocessing.
**Landing layer properties:**
- Append-only with full history
- Contains structured, semi-structured, or unstructured data in original file formats ranging from CSV, JSON, Parquet, ZIP, etc.
- Full or incremental loads, batch or streaming
- Shortcuts used where applicable
> _"But if we can load straight to delta tables in Bronze, doesn't a landing zone seems like a pointless copy?"_
- If the schema ever changes and adds fields, but you loaded it with a subset, you will have lost data.
- If there's ever any defect with your ingestion process (e.g. a data type conversion mistake), you will have lost data.
- If you can't tell the difference between receiving no data & an ingestion defect, you will have lost data.
Data storage costs less than transformation, which costs less than engineering time. When in doubt, we just keep it. Data lakes don't become swamps through volume, but through lack of structure.
This landing zone can be read-only to any service principal that does data processing, so it is very difficult to destroy anything in it. The landing zone is a primary resource for debugging, development, and recovery in case of issues with the ingestion process itself.
Directory structure:
```
<source>\<entity>\<schema_version>\lhe_ingest_year=<yyyy>\lhe_ingest_month=<MM>\lhe_ingest_date=<yyyy-MM-dd>\lhe_lineage_key=<lineage_key>\"<entity>_<yyyy-MM-dd>_<lineage_key>_<part>.<extension>"
```
How do we handle incremental loading from arbitrary source systems?
Templates which ingest data from source systems can write a `_checkpoints` subfolder within the landing zone entity folder. This folder should contain any information required to process the entity incrementally - usually a watermark or “checkpoint” value, which could be a timestamp or incrementing id. Keeping checkpoints contained within the landing zone entity allows data to be moved between environments (e.g. refresh dev from prod) without maintaining separate control tables. This is also consistent with how we store checkpoints from Spark Structured Streaming in the destination Delta table.
### Bronze
_Purpose:_ Apply schema versioning, drop obviously corrupt data, and transition to Delta format.
In Bronze, we apply schema and minimal initial processing to our landing zone data. Bronze tables are append-only Delta tables populated using Spark Structured Streaming in batch mode via `.trigger(availableNow=True)`. Rather than running a continuously-on stream, the job spins up, consumes all data available at that moment, and then gracefully shuts down. This gives us the simplicity of scheduled batch job with one key advantage: state management . Structured Streaming persists a checkpoint of everything it has already processed, so each run automatically picks up only the new files that have landed since the last execution, with no need for us to manually track high-water marks, maintain "last processed" timestamps, or diff the landing zone ourselves. That same checkpoint makes ingestion idempotent and fault-tolerant. If a run fails partway through, the next invocation resumes exactly where it left off without re-ingesting or duplicating rows.
![[Pasted image 20260527094358.png]]
Table structures correspond to the source system tables as-is, with metadata columns including ingestion date, source file, and GUIDs for lineage tracking and cross-referencing audit tables in our metadata database. In short, the Bronze layer consists of immutable & largely unvalidated data in append-only Delta tables, using delivery-based partitioning to keep merges into Silver efficient.
**Bronze layer properties:**
- Retains the full history of ingestion for each entity
- No schema validation
- Technical validation only in case of completely invalid rows or corrupt data
- Data uses the raw state (“as-is” structures)
- Data is immutable
- Delivery-based partitioning
- Transformed to Delta data format
- Enriched with metadata
- Ingest timestamp
- Lineage key
- ABFS path of source file in landing zone
- Can be used for debugging, testing
Other notes:
- In our implementation, when processing from bronze to silver in the "full" paradigm we just need to load the latest lineage key and overwrite the destination. No business keys or knowledge of the dataset is required.
- When processing from bronze to silver in the "incremental" paradigm, MERGE & business keys are necessary.
A sample of our Bronze-specific Spark configuration overrides:
```python
# Bronze is write-heavy and populated through streaming ingestion
spark.conf.set("spark.fabric.resourceProfile", "writeHeavy")
# Keep compaction targets small enough for fast downstream merges into Silver
spark.conf.set("spark.databricks.delta.autoCompact.maxFileSize", "134217728") # 128MB
# Keep parquet row groups aligned with the Bronze file-size target
spark.conf.set("spark.sql.parquet.rowGroupSizeBytes", "134217728") # 128MB row groups
# Native execution is disabled here because Bronze relies on structured streaming patterns
# https://learn.microsoft.com/en-us/fabric/data-engineering/native-execution-engine-overview?tabs=pyspark
spark.conf.set("spark.native.enabled", "false")
```
### Silver
_Purpose:_ Produce a reliable, analytics-ready base dataset that is broadly usable (not yet business-specific). Silver acts as the core data warehouse layer in many respects, providing an inventory of standardized & validated tables for fulfilling specific business requirements in Gold.
The silver zone comprises validated, enriched, and standardized data, prepared for further analysis and modeling. In our Silver layer, entities still correspond to source systems, with metadata, quality checks, naming conventions, and (optionally) historicization applied. If business users want to see the source system data as-is - they are asking for Silver.
In our implementation we have not done "enterprise modeling" or "data according to business" in our Silver layer (at least, not yet). There is no vault or 3NF occurring here.
**Silver layer properties:**
- Data is stored in write-optimized Delta tables, expecting frequent loads & merges from bronze in addition to reads from gold
- Technical validation of data quality. We typically fail loads entirely for serious quality issues, or tag rows with quality warnings using Great Expectations.
- Deduplication - MERGE based, overwrite based, or with SCD2 applied.
- Anonymization or removal of sensitive data
- Standard table and column naming convention: `snake_case`
- No business modeling applied
A sample of our Silver-specific Spark configuration overrides:
```python
# Silver is write-heavy, with frequent merges and validation passes
spark.conf.set("spark.fabric.resourceProfile", "writeHeavy")
spark.conf.set("spark.sql.streaming.schemaInference", True)
# Keep Silver files compact enough for merges without prematurely optimizing for read-mostly patterns
spark.conf.set("spark.databricks.delta.autoCompact.maxFileSize", "134217728") # 128MB
# Match parquet row groups to the Silver file-size target
spark.conf.set("spark.sql.parquet.rowGroupSizeBytes", "134217728") # 128MB row groups
# Native execution is disabled because the write/merge path matters more here than read optimization
# https://learn.microsoft.com/en-us/fabric/data-engineering/native-execution-engine-overview?tabs=pyspark
spark.conf.set("spark.native.enabled", "false")
```
### Gold
Data is joined, source systems are merged into business concepts (i.e. materials, sales, inventory, customers). Data is organized into schemas based on domains or projects after being transformed into a final consumption-ready state based on the use case. This data can be served via T-SQL endpoints, Fabric notebooks, Power BI semantic models, or even pipelines/integrations back to OLTP systems. Every table in Gold exists for a defined business purpose.
Various project-specific data products (e.g. Budget, Finance & Operations, Safety) are housed within this layer as Kimball-style star schemas or rarely as One-Big-Table style reports, depending on the need. This layer is fully read-optimized, V-ordered, and tuned for query performance.
One of the major themes of the Hub project is that data becomes much more usable once as much as possible sits under a single SQL endpoint. Schema-enabled lakehouses make that practical because many projects and domains can coexist as schemas within one Gold lakehouse instead of forcing us to spread across many separate lakehouses ([What are lakehouse schemas?](https://learn.microsoft.com/en-us/fabric/data-engineering/lakehouse-schemas)). In practice, that means a Power BI model, an Excel analyst, an SSMS user, or another downstream consumer can access all the enterprise-facing data products published by our team through one organized object in the OneLake catalog.
#### What’s in Gold?
In our implementation, Gold contains three different entity types:
1. **Ordinary Delta tables that we build ourselves.** These are the classic lakehouse-engine outputs where we use `MERGE`, overwrite, or whatever else is needed to materialize a final Gold table. The implementation might live in PySpark or Spark SQL, depending on the workload. This is a relatively small percentage of our Gold objects.
2. **Traditional T-SQL views.** For some high-velocity transactional data in Silver, very little additional cleansing or reshaping is required before the data is usable. In those cases, we prefer not to create another materialized layer unless it provides a clear benefit. A T-SQL view in Gold can simply present the latest Silver state to consumers immediately. That keeps latency low and avoids an extra refresh layer.
3. **Materialized lake views (MLVs).** This is by far the dominant pattern in our Gold layer. Roughly 90% of the business-facing content in Gold is implemented as materialized lake views.
The reason MLVs fit Gold so well is that they let us express business logic declaratively in SQL while Fabric handles the materialization, refresh strategy, and dependency ordering. Microsoft positions MLVs specifically for medallion-style lakehouse transformations and documents that they support declarative SQL authoring, automatic refresh optimization, dependency management, built-in monitoring, comments, and data-quality constraints:
- [What are materialized lake views in Microsoft Fabric?](https://learn.microsoft.com/en-us/fabric/data-engineering/materialized-lake-views/overview-materialized-lake-view),
- [Spark SQL reference for materialized lake views](https://learn.microsoft.com/en-us/fabric/data-engineering/materialized-lake-views/create-materialized-lake-view)).
These capabilities are a good fit for us. We prefer as much business logic as possible to be expressed in SQL. We want the table definitions to be easy to read, easy to source control, and easy to reason about. With the `CREATE MATERIALIZED LAKE VIEW` syntax, we can attach comments, arbitrary metadata in key-value pairs, and add constraints along with the table definition. Those constraints can be simple or surprisingly expressive, which makes MLVs a practical way to enforce final Lakehouse-level data quality expectations before the data becomes business-facing.
MLVs also line up well with the monitoring approach described later. When Gold refreshes run, Fabric can choose no-refresh, incremental, or full refresh strategies depending on source changes and query characteristics. When Change Data Feed is enabled on the source Delta tables (including our Open Mirroring databases), MLVs can take advantage of optimized refresh behavior rather than full recomputation every time ([Optimal refresh for materialized lake views in a lakehouse](https://learn.microsoft.com/en-us/fabric/data-engineering/materialized-lake-views/refresh-materialized-lake-view)). This helps us keep Gold declarative, monitorable, and incremental.
#### Security and access in Gold
Our organizational bias is that most operational and supply-chain data should be broadly available internally. We want plants, operations leaders, supply-chain teams, and analysts working from a shared understanding of production and logistics metrics rather than each group building its own isolated version.
The stricter controls are around financials and sales. Row-level-security in our main Finance and Operations semantic model is the primary mechanism for controlling access to sensitive financial detail. Data owners determine who should see those slices (by account group, company code, profit center, etc.), and we enforce through the semantic model.
We also maintain separate security groups for analysts who need direct query access to Gold through tools outside the central semantic model. The important governance principle is that the business should be extending the central layer, not reinventing it. If analysts build something useful on top of Gold, that should create a feedback loop:
- Monitor usage.
- Watch for duplicate metric definitions or forks of business logic.
- Where it makes sense, absorb the useful additions back into the central platform.
**Gold layer properties:**
- Data is stored in read-optimized Delta tables with V-Order applied
- Application of business rules, post-processing, calculations
- Addition of business metadata such as descriptions and translations
- Standard table and column naming conventions (i.e. `Title Case`)
- Table and column descriptions including the origin and business purpose of the table or field.
- Primary zone for applications, business teams, and other users to consume data products
_Goal:_ Provide high-quality, vetted datasets for end-user analytics. Each Gold dataset is treated as **“data product”** delivered to the business. Our Power BI semantic models are exclusively built from this layer.
A sample of our Gold-specific Spark configuration overrides:
```python
# Gold is optimized primarily for read performance and Direct Lake serving patterns
spark.conf.set("spark.fabric.resourceProfile", "readHeavyForPBI")
# Use a larger compaction target for read-mostly tables
spark.conf.set("spark.databricks.delta.autoCompact.maxFileSize", "1073741824") # 1GB
# Gold favors NEE unless using Structured Streaming
# https://learn.microsoft.com/en-us/fabric/data-engineering/native-execution-engine-overview?tabs=pyspark
spark.conf.set("spark.native.enabled", "true")
# Collect extended statistics to help downstream query planning
# https://learn.microsoft.com/en-us/fabric/data-engineering/automated-table-statistics
spark.conf.set("spark.microsoft.delta.stats.collect.extended", "true")
# Allow fallback behavior for snapshot generation on the most business-critical read layer
spark.conf.set("spark.microsoft.delta.snapshot.fallback.enabled", "true")
# Enable V-Order for Gold tables that serve Direct Lake and SQL endpoint reads
spark.conf.set("spark.sql.parquet.vorder.enabled", "true")
# Enable optimized writes for read-oriented downstream engines
spark.conf.set("spark.databricks.delta.optimizeWrite.enabled", "true")
spark.conf.set("spark.databricks.delta.optimizeWrite.binSize", "1g")
```
### Sandbox
This highly flexible zone consists of multiple workspaces for ad-hoc analysis, data science, and reporting. In Fabric terms, we're talking about personal workspaces, feature workspaces with temporary data, and shortcuts to business-managed "Shared" workspaces.
Sandbox properties:
- Workspaces and lakehouses owned by central platform team or business users
- Content may be productionized and absorbed into the core AANA Hub workspaces as needed
## Open Mirroring
Open Mirroring is a Fabric feature that lets any external system push change data into a Fabric-managed landing zone in OneLake, using a documented file format and change contract. Fabric handles the rest: applying those changes to Delta tables, maintaining table state, and exposing the result for SQL, Spark, and Power BI consumption. The result is a continuously updated Delta Lake copy of the source system entities, with no Spark cluster, no pipeline, and no notebook on the Fabric side doing the merge work ([Open mirroring in Microsoft Fabric](https://learn.microsoft.com/en-us/fabric/mirroring/open-mirroring), [Open mirroring landing zone requirements and format](https://learn.microsoft.com/en-us/fabric/mirroring/open-mirroring-landing-zone-format)).
1. **Storage is free up to 1 TB per capacity unit.** On an F64, that is 64 TB of mirrored storage included in the capacity. On our P1 / F64, this effectively gave us a free silver layer for SAP.
2. **Compute is free.** The Fabric background compute used to replicate data into Delta Lake format does not consume Fabric capacity, even though downstream SQL, Spark, and Power BI usage still does. For running hundreds of SAP tables on a single capacity, it's hard to beat "free."
We tested the alternative - orchestrating notebooks and config to incrementally process hundreds of SAP tables into a silver lakehouse - but it consumed a significant portion of capacity we would rather spend on gold-layer transformations, semantic model refreshes, and interactive Power BI usage. Open Mirroring moved that workload off our capacity entirely.
### AecorSoft partnership
Open Mirroring provides a destination spec. Something still has to extract data from SAP and write parquet files in the format Fabric expects. We worked with **AecorSoft**, our SAP data integration vendor, over the course of a year to build out Open Mirroring as a first-class destination inside their product, AecorSoft Data Integrator (ADI).
We had been using ADI successfully with Azure SQL DB and Synapse since 2022, so the vendor relationship pre-dated Fabric. The Open Mirroring build-out was a co-development effort: AecorSoft built the destination capability into ADI, and we provided the production workload, edge cases, and feedback. AecorSoft was selected for several reasons:
1. Full compliance with the SAP application layer, so extractions are governed by SAP's own security and transport model rather than bypassing it at the database.
2. Broad coverage of SAP entity types: tables, CDS views, RFCs, and ABAP reports.
3. **Super Delta** functionality - basically change data capture made easy for very large transactional tables (ACDOCA, MATDOC, AFRU). Without efficient CDC, these tables would not be viable for near-real-time replication.
4. Native support for Open Mirroring as a destination, once the joint build-out was complete.
Today, 98% of our SAP tables are replicated through ADI into Open Mirroring, multiple times per hour for the highest-velocity tables. SAP entities that do not fit (one-off extracts, ABAP reports, BW extractors) continue to land in the bronze layer via the "normal" landing-zone path.
![[Pasted image 20260527094622.png]]
>*AecorSoft Data Integrator writes parquet files to the Open Mirroring landing zone with a **`__rowMarker__`** column. Fabric handles the rest.
### Naming and task structure in ADI
Every replicated SAP entity has a corresponding ADI task. The naming convention encodes the task type, SAP entity, source system, and destination:
| Component | Description | Example |
| ----------- | ----------------------------------------------------------------------- | -------- |
| Task type | `SDL` (Super Delta), `TBL` (Table), `EXT` (Extractor), `CDS` (CDS view) | `SDL` |
| Entity | The SAP entity being extracted | `ACDOCA` |
| Source | Source SAP system abbreviation | `S4P999` |
| Destination | `OM` for Open Mirroring, `LH` for lakehouse | `OM` |
Resulting task names: `SDL_ACDOCA_S4XXXX_OM`, `EXT_0FIAP4_S4XXXX_LH`.
Each SAP entity has one task per SAP source system, three in our case . Tasks for a single entity across multiple SAP sources are grouped into task chains, and task chains never mix SAP source systems. The SAP system impacted by a given chain is always obvious from the chain name.
> [!warning] You accept additional overhead and complexity when you integrate data from the preproduction environments of other teams. Avoid this unless absolutely necessary. During our major ERP implementation project, working with SAP test data in Fabric/PBI was unavoidable.
For the largest transactional tables (ACDOCA, MATDOC, AFRU), we need additional ADI configuration:
1. **Rolling window filters** of N days based on a timestamp, fiscal year, last modified, or clearing date column. We're looking to apply filters to ensure the delta snapshot only evaluates rows that could have changed within the window. This is essential for keeping snapshot times short on tables with hundreds of millions of rows. Even a simple fiscal year filter can keep the snapshot duration from continuing to scale.
2. **Upsert mapping** for inserts and updates. SAP tables that do not perform hard deletes are configured so that inserts and updates both map to upserts in Open Mirroring. This makes reinitialization safer; if we need to reset delta pointers in ADI, replaying data does not produce duplicates.
3. **Filter on delta only** is used to bypass the rolling window filter during an initial load (so the full table is captured).
4. **aecorRecent** files stashed in the Open Mirroring landing zone ensure that when an entity’s delta pointer is reset from ADI, replication resumes from the last written parquet file in Open Mirroring, preserving the sequential file ordering that the Open Mirroring landing zone requires. This is necessary if we need to reset a delta pointer on one of these very large upsert-only tables.
These defaults are the result of running Open Mirroring with real SAP workloads for six months. We are able to replicate frequently through the SAP application layer with minimal overhead and minimal strain on the source system.
### Where to manage incremental state?
One of the most important lessons in extracting SAP data to a non-SAP platform is *state ownership*. Historically, many SAP landscapes leaned on BW extractors or ODP-managed deltas. That works when the destination is also an SAP analytics product, but get's tricker when you're going external.
With classic delta extraction: SAP may believe it has successfully delivered the data, so it advances its delta pointer. Then something external to SAP fails: software crashes, a copy operation fails after staging, or the target destination is unavailable. From SAP's perspective the transfer succeeded. Without robust error handling and retry logic, you have lost data and backfill headaches.
This was the architectural reason we prefered ADI's **Super Delta** approach. A single tool is responsible for extracting from SAP, retaining incremental state, computing the snapshot that determines inserts, updates, and deletes, and publishing files in Open Mirroring format. Once those files land, Fabric's mirroring engine applies them into Delta tables based on the landing-zone contract, including ordered files and `__rowMarker__` operations ([Open mirroring landing zone requirements and format](https://learn.microsoft.com/en-us/fabric/mirroring/open-mirroring-landing-zone-format#format-requirements), [What is Mirroring in Fabric?](https://learn.microsoft.com/en-us/fabric/mirroring/overview#how-does-open-mirroring-work)).
If anything goes wrong before the change files are written, the task can be rerun without having falsely "spent" the source-side delta state. We do not need brittle compensating logic to infer whether a pointer advanced too early or whether a given delta was only partially written downstream. And with upsert change mapping, we can replay data idempotently.
### Source-system impact
A recurring question is whether this level of replication beats up the SAP source system. It can, if you aren’t careful.
ADI's Super Delta implementation uses SAP HANA resources to calculate the snapshot difference and derive the change log. Conceptually, the engine is determining what changed between the previous state and the current state, then writing only those inserts, updates, and deletes. The goal is to refresh as often as the business needs while constraining the amount of source data each comparison has to examine.
That is why we tune for lower source impact, even if that means longer task duration. We aggressively apply rolling-window filters so a given delta snapshot evaluates only data that could plausibly have changed. On very large SAP tables, posting date, clearing date, a last-changed timestamp, or even a coarse filter such as fiscal year can dramatically reduce the amount of data the snapshot has to read. The result is that we can run many hundreds of extraction tasks, with selected high-value tables refreshing multiple times per hour, without creating unacceptable CPU pressure on HANA.
We benchmark extraction settings with our SAP team. That part is non-negotiable. If you are pulling from SAP this frequently, you need evidence that your extraction pattern is not creating an impact. Otherwise, you’re setting yourself up to have every incidence of slowness in the source system blamed on extraction activities.
### Open mirroring data in the lakehouse
Open Mirroring databases are separate Fabric items, not lakehouses. They expose delta tables but do not live inside our main lakehouses. We bridge the gap with OneLake shortcuts. Every Open Mirroring database is shortcut into a dedicated schema inside our silver lakehouse. Our objective is to centralize our enterprise systems of record in the Hub under a single SQL endpoint.
- **New tables appear automatically.** When a new entity is added to ADI and starts replicating, it shows up in the silver lakehouse within 1-2 minutes, with zero touch on the Fabric side. The cost of onboarding a new SAP table is the time spent configuring one ADI task.
- **Silver is virtualized.** Part of our silver layer is "real" Lakehouse delta tables we wrote ourselves with Spark, with our naming conventions, metadata columns, and quality rules applied. The Open Mirroring portion is a shortcut to delta tables managed by Fabric. Schema shortcuts make it easy to "virtualize" data into a single lakehouse.
- **The mirrored tables are the source system's state.** Open Mirroring tables represent the current state of the SAP table plus audit metadata inserted by ADI (source system, ingestion timestamp, run IDs). Options for inserting additional standardization, validation, or cleansing rules are limited.
When the business wants the current state of the source, refreshed quickly, Open Mirroring delivers. In all cases, we have our standard Spark toolbox.
### Open mirroring in production
Open Mirroring is fast and cheap, but it is not entirely hands-off. It took time to understand the workflow and failure modes. Most of the complexity is around handling *reinitialization* scenarios, which should be hopefully rare once replication is up and running.
#### Another kind of throttling
Open Mirroring throttles at 1 TB of _change data_ processed per-database in a 24-hour window. The unit being measured is `processedBytes` reported by the mirroring status API, not the size of the parquet files you send.
We hit this in January 2026 while initializing a single OM database in a dev workspace. We had loaded 117 tables, roughly 22 GB of parquet across 8,000 files. Replication throttled. Querying the `Get tables mirroring status` API revealed that the single largest table alone reported 1,024 GB of processed bytes - roughly 66x the physical parquet size on disk. We quickly realized `processedBytes` is a function of internal Fabric work, not the size of the parquet you copy to the OM landing zone, and it is not visible in the mirroring UI. Planning for Open Mirroring needs to account for this multiplier, particularly during reinitialization. There is no mitigation for throttling other than waiting for the 24-hour window to roll off. I’ve heard that some implementations split tables across multiple mirrored databases to alleviate this limit, as well as the overall 1000 table limit (formerly 500). We haven’t had the need to do this, however, and still keep one OM database per SAP source system.
#### Initial loads
For large tables (and by "large" I mean hundreds of millions of rows and several hundred columns), the time between "files are in the landing zone" and "rows appear in the mirrored table" can be up to 12–24 hours, regardless of the file strategy used (many small files, few large files, with or without `_metadata.json`, with or without `__rowMarker__`). The mirroring UI shows "Running, 0 rows replicated" for the entire period, then snaps to complete. There is no progress indication.
This is a headache for tables that take a long time to backfill from SAP. If we were forced to stop and restart replication on a mirror db, we could be without fresh data for a full day or more. Open Mirroring does not have a native replay, backup, or restore concept. The mirrored delta tables are managed by Fabric, and sometimes the only way to recover from a failed mirror database is to reinitialize. For 99% of our tables that can backfill from SAP in minutes to hours, this is not a problem. For a few large, high-velocity transactional tables, we occasionally backup the OM delta table and have a process to regenerate any partition as parquet files according to the sequence and naming convention Open Mirroring expects. This way we don't need to reload a 400 million row `ACDOCA` table from SAP.
We have been in touch with the Fabric product team about our Open Mirroring experiences, and to their credit they have made significant performance improvements in this specific scenario: initializing large tables from many parquet files dumped into the landing zone all at once.
You might ask: why are we concerned about reinitialization? In theory, you should never need to reinitialize the OM database once replication has begun. That is true, but Mirrored Databases still have some limitations that could result in the need for a reinit. First, as of June 2026 they remain permanently tied to the identity of the user who created them. If that user’s account is disabled, the only option is to recreate the database. Second, early in our experience with OM, we found that tables left in a failed state for 30+ days could no longer be dropped through the normal process of deleting the landing zone entity. Those failed tables would remain "stuck" until the entire mirroring process was stopped and restarted.
### Bottom line
If Fabric-native ingestion methods like Mirroring and shortcuts are available for your data sources, you should strongly favor them in your design up front. They don't remove the need for strong metadata-driven processes. Most real world platforms will have many sources that will need traditional extraction pipelines. Where available, Open Mirroring is an easy, cheap, and continuously-updated delta representation of the source tables. For us it's a great fit. We've been replicating hundreds of SAP tables and CDS views, many multiple times per hour, with zero issues for months on end. We're quite happy to monitor OM and backup some key tables instead of spending the capacity on our own ingestion and MERGE processing.
Improvements I'd like to see for Open Mirroring:
1. Specify that the "free" compute for open mirroring is limited to 1TB of change data per day, but let us continue replication beyond 1TB at the cost of regular CU usage like any other workload. I'd rather spend CUs to continue replicating in a re-initialization scenario than wait a full day for throttling to reset. Call it a mirroring [“extended capability”](https://learn.microsoft.com/en-us/fabric/mirroring/extended-capabilities) like CDF or scheduled view replication.
2. Allow us to retain an append-only record of all data ingested by mirroring, even if we are using __rowMarker__ to MERGE the final tables we expose from the OM database. The typical lakehouse pattern is to keep an append-only record of ingestion to replay downstream layers on demand. Basically, don't clean up `_ProcessedFiles` if I pay standard OneLake storage fees for the data there.
3. Allow some basic sanitization of column names, and addition of basic metadata columns, similar to the "Audit column" feature recently introduced for Copy Job.
## Metadata framework
Concepts:
1. A metadata database hosted in a Fabric SQL Database. It stores the declarative configuration that tells Fabric pipelines and notebooks what to run, in what order to run it, what connections and parameters to use, and audit trail of executed tasks.
2. Standard enterprise features for logging, lineage, orchestration, and error handling. These concepts do not need to be re-engineered for each new project or pipeline
3. Dynamic orchestration, where Fabric artifacts can be grouped and executed as a set, with dependencies defined in metadata.
4. Highly parameterized, flexible, and reusable Fabric artifacts including pipelines, notebooks, dataflows, stored procedures, functions, and semantic models.
This Fabric SQL database serves as the metadata control plane for the AANA Hub.
The point of this framework is that logging, lineage, orchestration, retries, parameterization, and error handling are platform concerns. They should not be re-invented for every project. If a new workload requires us to copy data, run a notebook, execute validation, and publish to a downstream model, the interesting work is in the business-specific metadata and transformations, not in rebuilding the same control flow for the fiftieth time.
> [!NOTE]
> The framework defines reusable templates and task groups which share metadata. That gives the team a consistent way to onboard new workloads, orchestrate, and monitor execution across multiple solutions.
From a technical perspective, the database implements four core capabilities:
- Configuration management for connections, artifacts, task groups, and individual tasks
- Runtime compilation of metadata stored as JSON into an execution-ready table of tasks
- Sequenced orchestration through driver and worker pipelines
- Auditing for task execution, failures, and copy performance
### The metadata database
This Fabric SQL database is an operational metadata store that determines the structure, order, and necessary parameters for all scheduled Hub activities.
- The `config` schema defines what should run, and with what parameters.
- The `devops` schema resolves template names/keys to Fabric workspace & artifact GUIDs.
- The `audit` schema records what happened at runtime, including copy statistics, errors, Monitor Hub and Spark Monitoring URLs
Our design was initially informed by many of the concepts in the **DWA** metadata framework - particularly JSON inheritance - but as you might expect we reviewed multiple open source metadata frameworks for Fabric, including **FMD** and **AquaShack** before ultimately building something specialized and unique for our needs. Still, I highly recommend taking a close look at these open-source frameworks to understand what features you may want in to build for your own metadata driven Fabric project:
1. [ProdataSQL/DWA: Fabric Data Warehouse Automation](https://github.com/ProdataSQL/DWA)
2. [edkreuk/FMD_FRAMEWORK: The Fabric Metadata-Driven Framework (FMD) is a cutting-edge accelerator designed to optimize data handling and utilization.](https://github.com/edkreuk/FMD_FRAMEWORK)
3. [ChristianHenrikReich/AquaShack](https://github.com/ChristianHenrikReich/AquaShack)
4. [bennyaustin/fabric-accelerator: Accelerator for building a Microsoft Fabric data platform with reusable components and an ELT orchestration framework. Automates up to 80% of Bronze and Silver layer processing, so you can focus on business insights in the Gold layer.](https://github.com/bennyaustin/fabric-accelerator)
### Metadata design
The framework is built on a layered inheritance model:
```text
Configurations -> Templates -> Packages -> Task Groups -> Tasks
```
We wanted to define common behavior once, then apply it many times without cloning pipelines and notebooks all over the platform. In this model, configurations hold connection and environment settings. Templates define reusable implementation patterns. Package groups define a business-facing unit of orchestration. Task groups define shared defaults. Tasks define the actual work items. At runtime, all of that is compiled into a flattened execution table, while `audit.task_log` records what happened. All metadata is written in JSON and source controlled.
A task can inherit settings from its task group, which can inherit from a template and one or more configuration records. In case of conflicts, the lowest, most specific layer wins. That lets us onboard a new workload by describing it in metadata rather than rebuilding the same control flow again. The `devops.artifacts` table maps logical artifact names to the actual workspace and artifact IDs, so promotion across environments does not depend on hard-coded GUIDs. We populate this table as a post-deployment step in CI/CD.
### Runtime Execution Flow
A concept you will encounter in nearly all ADF, Synapse, and Fabric based metadata frameworks is nested pipelines. Some frameworks call these “Parent” and “Child” pipelines. Ours are “Driver” and “Worker” but the concept is the same.
At runtime, orchestration follows a fixed path:
```mermaid
flowchart TD
A[Metadata in config schema] --> B[DP_Driver invokes usp_task_sequence, dispatches worker pipeline]
B --> C[DP_Worker invokes usp_task_queue]
C --> E[DP_Worker executes queued tasks in sequence or in parallel according to metadata]
E --> F[audit.usp_task_start]
F --> G[DP_Worker executes invidual artifact i.e. notebook, pipeline, model refresh]
G --> H[audit.usp_task_end_success]
G --> I[audit.usp_task_end_failure]
G --> J[audit.usp_task_log_copy for copy metrics]
```
The driver pipeline determines a sequence of work for the selected package group and stage. The worker pipeline then retrieves the execution-ready tasks by querying the database. From there, the worker executes the relevant notebook, pipeline, refresh, or copy activity, while the audit layer records start, end, status, errors, and copy metrics such as rows read and data moved.
![[Pasted image 20260608155752.png]]
>*Overview of DP_Driver*
![[Pasted image 20260608160003.png]]
>*Overview of DP_Worker*
This design allows many changes can be made by simply updating metadata instead of creating or modifying Fabric artifacts. It also encourages reuse by pushing common behavior into templates and task groups instead of letting every project become a one-off.
We maintain configurations, templates, task groups, and tasks as JSON, which compile to the metadata database during CI/CD. The Driver pipeline determines what should run. The Worker pipeline executes the resolved tasks. The audit table records what happened.
## Identity and authentication
We use **workspace identities** and **service principals** over personal OAuth tokens everywhere Fabric supports it, and segment those identities by environment. Dev identities should not be able to access prod, and vice versa. This is essential for preventing cross-environment execution, which in a complex environment is a risk no matter how careful you are.
We adhere to the following principles considering the execution context of scheduled Hub activities:
1. Environments should be isolated to the maximum extent possible. We must reduce the risk of activities in a development environment affecting a production environment, and vice versa.
2. Use of user tokens (OAuth) should be minimized. This is not always possible in Fabric (e.g. the entire concept of [item ownership](https://learn.microsoft.com/en-us/fabric/fundamentals/item-ownership-take-over)), but we should use service principals or workspace identities when possible. These identities should be accessible to the platform team and assigned the minimum permissions necessary.
3. Exceptions are be treated as technical debt. We document the less-than-ideal execution paths that Fabric sometimes requires, and continuously review as more connections support Workspace Identity and Service Principal auth types.
### Invoke Pipeline
**Invoke Pipeline** is a critical activity for Hub orchestration.
1. Trigger pipelines invoke `DP_Driver`
2. `DP_Driver` invokes `DP_Worker`
3. `DP_Worker` invokes other integration pipelines/notebooks/models
The "Connection" field of the Invoke Pipeline activity does not support dynamic content (as-of November 2025). That means we cannot parameterize the pipeline connection using a Variable Library. We need one connection per environment, and the best available pattern is for that connection to use a [Workspace Identity](https://learn.microsoft.com/en-us/fabric/security/workspace-identity). A workspace identity is effectively a Fabric-managed service principal associated to a workspace and granted access to other Fabric resources.
**Bottom line: each Invoke Pipeline activity should authenticate using a Workspace Identity**, and the identity should be granted access to the pipelines which need to be invoked.
In practice, this means using a workspace identity for the Core workspace in each environment, and granting that identity Contributor permissions only to the Hub workspaces for that same environment. Dev Control should reach Dev resources. Test Core should reach Test resources. Prod Core should reach Prod resources. Never more than that.
Our Core workspace identity is used for execution of the main Driver and Worker pipelines. These workspace identities need Contributor access on each Hub workspace in the same environment, and they must belong to a security group which has permission to use the Fabric APIs. They also need permission to use any referenced Connections, including the workspace identity connections themselves.
If the workspace identity is not configured correctly errors will occur. Here are several common failure modes we encountered:
1. **Workspace identity is not authorized to call Fabric APIs.** Solution: Add the workspace identity to a security group which is authorized to use Fabric APIs. API permissions are granted to security groups in the Fabric tenant administration page.
2. **Workspace identity does not have sufficient Workspace permissions.** Solution: Add the Control workspace identity as a Contributor on all Hub workspaces in the current environment (dev, test, or prod). Remember: workspace identities should never be granted access to more than one environment.
3. **Workspace identity does not have sufficient permissions on connections** referenced during pipeline execution. Solution: Grant User permission on the relevant Fabric connections to the workspace identity or security group. This could be a Fabric pipeline connection referenced during Invoke Pipeline itself.
> [!warning] Items without connections run as the "Last Modified By" user
> Activities using **connections** (e.g., Copy Data or Semantic model refresh) run under the **connection identity**.
>
> Items with no connection (such as Notebooks) run as the **last modified identity of the pipeline**, which could be a user or service principal.
### Fabric SQL database
The metadata database connection is also critical for pipeline execution.
1. `DP_Driver` obtains task sequencing from the meta db via a Script activity
2. `DP_Worker` obtains its task queue from the meta db via a Script activity
3. `DP_Worker` logs tasks to the meta db using a Stored Procedure activity
The same isolation rule applies here: pipelines in each environment must refer only to the correct metadata database for that environment. A dev pipeline should not be technically capable of triggering a notebook in a production workspace.
The "Connection" field for script & stored procedure activities supports dynamic connections. This means the connection, workspace, and SQL database for each environment can be passed via a Variable Library.
**Bottom line: connections to the metadata database can be parameterized with Variable Library, but Service Principals and Workspace Identities are not yet supported for Fabric SQL DB authentication.**
## CICD
![[Pasted image 20260527094534.png]]
We used the native Power BI and Fabric deployment pipelines for 5+ years, because they were the fastest route to getting discipline into the Power BI dev process. Dev, test, and production promotion with formal user acceptance testing was already a major improvement over editing production directly.
We did not start with a grand unified deployment design for CI/CD in Fabric, because frankly the platform made this almost impossible in 2023.
As the platform matured, we've found native pipelines do not give enough control for multi-workspace coordination, custom validations, or post-deployment parameterization at the level we need. So our process has gradually shifted toward Azure DevOps-driven CI/CD with the `fabric-cicd` library, where we can lint, run Tabular Editor checks and BPA rules, scan for vulnerabilities, promote artifacts in the correct order, and keep a precise mapping between deployed workspaces and our monorepo.
Variable Libraries have helped immensely since early 2025, but for the remaining gaps (especially semantic models), we rely on the Fabric CI/CD library to parametrize via YAML.
Our CI/CD journey is not complete and will undoubtedly need a blogpost of its own in the future.
At a high level, our repository is organized like this:
- `workspaces/` contains the Fabric content, in the Core and Analytics workspaces.
- `packages/` contains our shared Python package that supports metadata-driven Bronze, Silver, and Gold processing patterns. This is published to a Fabric Environment and used by all notebooks.
- `pipelines/` contains our Azure DevOps CI and CD pipeline YAML definitions.
- `scripts/` contains deployment, publishing, validation, and post-deployment automation used by the CI/CD, along with other "operational" and rarely used scripts.
- `docs/` contains our team wiki, published to Azure DevOps.
- `adi/` contains Aecorsoft Data Integrator configuration, including task chains and task definitions for SAP extraction.
```markdown
aana-hub/
|-- README.md
|-- workspaces
|-- core
|-- analytics
|-- packages
|-- pipelines
|-- scripts
|-- docs
|-- adi
|-- config
|-- task_chains
|-- tasks
```
Resources that helped us on our CI/CD journey:
1. [Optimizing for CI/CD in Microsoft Fabric | Microsoft Fabric Blog | Microsoft Fabric](https://blog.fabric.microsoft.com/en-us/blog/optimizing-for-ci-cd-in-microsoft-fabric?ft=All)
2. [kerski/fabric-dataops-patterns: Templates for weaving DataOps into Microsoft Fabric](https://github.com/kerski/fabric-dataops-patterns)
3. [CI/CD workflow options in Fabric - Microsoft Fabric | Microsoft Learn](https://learn.microsoft.com/en-us/fabric/cicd/manage-deployment)
4. [Fabric environment Git integration and deployment pipeline - Microsoft Fabric | Microsoft Learn](https://learn.microsoft.com/en-us/fabric/data-engineering/environment-git-and-deployment-pipeline#integrate-git-for-fabric-environments)
5. [AI-Powered CI/CD for Microsoft Fabric - Documentation Package](https://github.com/eugenecp/fabcon2026-ai-ci-cd/tree/main/Fabric2026-CI-CD-Complete-Package)
6. [Implementing Enterprise-Grade CI/CD for Microsoft Fabric — A Technical Deep Dive](https://medium.com/@ajit.iter06/implementing-enterprise-grade-ci-cd-for-microsoft-fabric-a-technical-deep-dive-8e019e4b3833)
7. [RuiRomano/fabric-cli-powerbi-cicd-sample](https://github.com/RuiRomano/fabric-cli-powerbi-cicd-sample)
## Monitoring
Monitoring in Fabric is one of those topics where the out-of-the-box tools are useful but not sufficient. Since 2023, we have taken observability seriously and built a monitoring framework with several layers: tenant-wide governance telemetry, Hub execution telemetry, links to native Fabric monitoring, and table-level views built on Delta Lake metadata and commit history.
We do a full nightly metadata scan of our Power BI and Fabric estate using the scanner APIs. Metadata scanning is foundational for governance because it gives us an inventory of workspaces, items, owners, endorsements, labels, and, for semantic models, deeper subartifact metadata such as tables, columns, measures, DAX expressions, and mashup definitions ([Metadata scanning overview](https://learn.microsoft.com/en-us/fabric/governance/metadata-scanning-overview)). A Fabric environment with hundreds of artifacts is not governable if your only inventory is opening workspaces by hand.
We pair metadata scanning with nightly retention of audit activity events using the activity events API ([Admin - Get Activity Events](https://learn.microsoft.com/en-us/rest/api/power-bi/admin/get-activity-events)). Microsoft only exposes these events through a rolling 30-day API window, so if you care about historical trends you need to retain them yourself. We do, and as a result we now have just under three years of Power BI and Fabric audit history. That historical log is invaluable to understand daily and monthly active users, see who is actually authoring content, evaluate whether Pro licenses are being used by the people assigned to them, and build tenant-level reporting on adoption, and workspace usage.
These governance feeds are extremely powerful when combined. Metadata scans tell us what exists. Audit logs tell us what people are doing with it. We also still use the native Capacity Metrics App, and we run our own lightweight views over the top of it:
1. The current background, interactive, and overall capacity usage %.
2. The 24-hour trend.
3. The top drivers of background and interactive capacity usage by workspace, item, and user.
> [!WARNING]
> Fabric-native job monitoring has some frustrating gaps. Monitor Hub is helpful, but not adequate as the primary day-to-day operating surface. In particular, the inability to filter by capacity or create saved views/bookmarks makes routine triage more cumbersome than it should be.
The AANA Hub metadata framework owns its own execution logging. Every orchestrated task execution is written to an audit table in the Hub metadata database. We capture the task identity, lineage key, template, key inputs and outputs, status, timing, and direct URLs back to the underlying Fabric experiences when available, including pipeline execution pages and Spark monitoring links. In practice, this gives us a one-stop view of the work *we* actually scheduled and executed, instead of pivoting between Monitor Hub, pipeline history, notebook runs, and Spark logs.
Yes, this introduces some overhead. Stored procedures must be invoked from the orchestration layer to write those logs. But the reason it is acceptable is the same reason the broader Hub model works: we do it once in the central framework. `DP_Driver` and `DP_Worker` own the logging, so we do not need to reinvent the wheel inside every notebook, pipeline, or individual project.
That same philosophy extends to materialized lake views (MLVs), which have become a major part of how we build in Gold. We query the lakehouse-local history table `dbo.sys_dq_metrics` that MLV refreshes leave behind as an audit source for our own reporting. Fabric tracks recent runs, execution status, lineage, and data-quality outcomes, including whether rows were dropped or a refresh failed due to a constraint violation. We also have visibility into whether a run used a no-refresh, full-refresh, or "optimal" path. ([Optimal refresh for materialized lake views in a lakehouse](https://learn.microsoft.com/en-us/fabric/data-engineering/materialized-lake-views/refresh-materialized-lake-view), [Data quality in materialized lake views](https://learn.microsoft.com/en-us/fabric/data-engineering/materialized-lake-views/data-quality)).
We also monitor from the table side, not only the task side. Inspired in part by Raki Rahman's [lineage project](https://www.rakirahman.me/openlineage-to-delta/) “Marquito,” we run a lightweight process to scan our Delta tables and capture key metadata, including commit history. This lets us monitor freshness and table status independently of task orchestration logs.
That table-level view lets us ask better questions:
1. Has this table been updated as recently as its historical pattern suggests it should have been?
2. Did the task succeed but commit abnormally small or abnormally large row volumes?
For classic Power BI refresh monitoring, we also use the **Refreshables API** for refresh counts, failure counts, average and median durations, schedules, and the most recent refresh state, while retaining a seven-day history up to sixty refreshes ([Admin - Get Refreshables](https://learn.microsoft.com/en-us/rest/api/power-bi/admin/get-refreshables), [Admin - Get Refreshables For Capacity](https://learn.microsoft.com/en-us/rest/api/power-bi/admin/get-refreshables-for-capacity), [Admin - Get Refreshable For Capacity](https://learn.microsoft.com/en-us/rest/api/power-bi/admin/get-refreshable-for-capacity)). That gives us a reliable way to understand whether semantic models and other “classic” PBI refreshables are healthy, and to combine that data with lakehouse freshness and Hub execution logs.
1. **Governance monitoring** through metadata scanning and audit logs.
2. **Capacity monitoring** through Capacity Metrics plus custom reporting.
3. **Hub execution monitoring** through our metadata framework audit tables.
4. **Table-level monitoring** through Delta history and freshness heuristics.
5. **MLV monitoring** through recent runs, lineage, data-quality signals, and lakehouse-local refresh metadata.
6. **Semantic model monitoring** through the Power BI Refreshables API.
No single Fabric pane gives us that unified picture: we had to build it. But once built, nothing beats a single view of our platform that connects tenant governance, telemetry, data freshness, and business-facing refresh health.
> [!NOTE]
> Note that these days you can skip a lot of the hard work simply by deploying [Fabric Unified Admin Monitoring](https://github.com/microsoft/fabric-toolbox/tree/main/monitoring/fabric-unified-admin-monitoring) or FUAM.
## A note on AI
What data platform introduction would be complete without mentioning generative AI?
AI has already had a direct impact on how fast we can build the platform. Beginning in earnest in 2025, as the metadata database and the Spark framework expanded, GitHub Copilot in VS Code became a real force multiplier. We would not have had the confidence to build our metadata db and Spark framework without the extra leverage. The value has mostly come from using coding agents inside VS Code, not from using Fabric's native Copilot features. Although they are getting better, I fundamentally do not believe the best use of AI is created highly specific, siloed experiences inside every Fabric workload. Most of these Copilots sit unused by us.
That said, we *have* had great results with the unified Fabric Copilot as a tool for answering questions from our enterprise semantic models. Longer term, I expect AI agents to become a primary consumer of the platform, not just a helper for us as developers. Tables, semantic models, definitions, synonyms, descriptions, and certified answers all need to be designed so that both humans and agents can use them. If the model does not understand our acronyms, plant terminology, material concepts, and KPI definitions, then the interface does not matter. The foundation is still metadata and context.
> [!NOTE]
> A major improvement we made in parallel with the AANA Hub project was consolidating many smaller siloed semantic models into one. This requires more DevOps maturity, since you need to be Git integrated to reliably collaborate on the same model. It's been absolutely worth it to direct Copilot to a single place for the vast majority of our KPIs and metrics. Not to mention it makes the classic problem of executive reporting far easier, because we don't need to bridge multiple models to report horizontally across the business. Highly recommended.
Agentic AI does not eliminate the need for shared enterprise dashboards. Dashboards, semantic models, and certified answers provide a common understanding of reality that an AI interface can route users toward. What AI should reduce is the endless accumulation of one-off ad hoc reports that only exist because someone asked a question one time, years ago.
## Learn from our mistakes
Fabric is still the youngest of the major data platforms. You can get surprisingly far on preview functionality, which is exactly what makes them dangerous. The first 90% of a feature can look promising enough to start designing around it. Then the last 10% turns out to contain the blocker: no service principal support, weak CI/CD support, missing APIs, connection quirks, or other undocumented limitations that only appears after you've spent precious time.
Some of our success came from recognizing which emerging Fabric capabilities had a credible path forward, jumping in early, and giving candid feedback to the product teams through programs like Enterprise Voice (EV). But read the fine print obsessively. In Fabric, it is very common for the blogpost or headline to look great, while essential enterprise features are missing entirely. When in doubt, stick to what's generally available (GA).
We also would have centralized much earlier. That lesson is already visible throughout the article, but it's worth restating. We spent too long tolerating a federated, over-segmented workspace model.
## Future
As we look into the second half of 2026, the most important fact is that we now have a foundation. But, we're far from finished. Fabric is still changing rapidly, and our DevOps practices are still maturing. The next phase for us is about simplifying the developer experience, reducing friction, and getting more leverage out of the foundation we already built.
The most immediate area of focus is CI/CD and local development. Today there is still too much friction in bouncing between local VS Code-based development and actually validating against Fabric compute. It works, but it is slower than it should be. One direction we are taking seriously is whether we can stand up local dev containers for each engineer. The goal would be to shorten the inner loop: faster unit testing, faster library iteration, faster transformation development, and less waiting around for deployments.
The second major area is **agentic software development**. Right now AI is an excellent developer assistant for us. It accelerates schema work, notebook work, Python work, and refactors. But we are not yet at the point where we routinely hand meeting notes to an agent and expect it to deliver a complete feature branch end-to-end. That is exactly the direction we are interested in. Take a requirement from Azure DevOps, let an agent work autonomously in isolation and come back with a pull request for human review. We are not there yet, but I suspect this will become an important productivity frontier for small platform teams.
We are also re-evaluating the role of notebooks in our implementation. Notebooks are a practical way to get moving, and I don't regret using them. But over time, we’ve also seen the shortcomings of so-called “Notebook Engineering.” Miles Cole has great takes on this topic in [Notebooks, Spark Jobs, and the Hidden Cost of Convenience](https://milescole.dev/data-engineering/2026/02/04/Notebooks-vs-Spark-Jobs-in-Production.html) and [Creating your first Spark Job Definition](https://milescole.dev/data-engineering/2026/02/04/Creating-your-first-Spark-Job-Definition.html). His blog, [Miles Cole | A Microsoft data & analytics blog](https://milescole.dev/), has been a valuable resource for our Fabric and Spark engineering journey.
We already have a shared Python wheel and a configuration-driven lakehouse framework. The obvious next step is to keep pushing more logic into reusable Python packages and make notebooks thinner, more declarative, and less responsible for core business logic. In many cases, that could mean replacing notebooks altogether with Spark job definitions.
If we can get to the point where a large share of lakehouse processing is executed through a single well-structured Spark application, orchestration becomes simpler too. Pipelines can become thin wrappers: do some ingestion, invoke the lakehouse framework, then refresh a downstream semantic models.
This also connects to a broader design question we are taking seriously: how much of our current metadata-driven framework is a permanent architecture, and how much of it is a transitional response to the Fabric of 2023-2025? When we built the Hub, a metadata database gave us consistency, orchestration, reuse, and control. With more ingestion from Open Mirroring, more shortcuts, better MLV support, and more Fabric-native mechanisms for moving data, there is a legitimate question about whether some of our current complexity can eventually collapse into more declarative models.
We should continuously ask how the future state can be faster, simpler, and better than the current one. Could more ingestion be expressed declaratively through mirroring and Copy Job? Could our python wheel become the only execution surface for transformation? Could pipelines eventually become little more than wrappers that trigger ingestion, run the main Spark application, and refresh semantic models?
Another major future theme is **Direct Lake**. We are not yet using Direct Lake for our largest and most important semantic models. Before that becomes realistic, we need to keep moving business logic out of separate workspaces & legacy places such as Dataflow Gen1 and into the Hub. We will trial Direct Lake by the end of 2026 on our largest semantic model, once more of the business logic is pushed upstream.
That said, Direct Lake absolutely remains on our roadmap. Microsoft positions Direct Lake as especially relevant for IT-driven, lake-centric architectures (hey, that's us!) but explicitly reminds us that Import mode is still the right choice for many scenarios ([Direct Lake overview](https://learn.microsoft.com/en-us/fabric/fundamentals/direct-lake-overview#when-should-you-use-direct-lake-storage-mode)).
And to be clear: there is nothing wrong with Import mode. Import is tried and true. It is efficient when you know what you are doing. It gives an excellent report-consumer experience. And with incremental refresh plus selective table refresh patterns, it can be a highly optimized setup in its own right. We do use Direct Lake today in some smaller scenarios, but I do not view Import as something to "escape" from. It will remain relevant for years.
So the future outlook is a series of simplifications:
1. Make the local development loop faster.
2. Reduce rough edges in CI/CD and execution.
3. Move more logic into shared code and less into notebooks.
4. Explore Spark job definitions and thinner orchestration.
5. Push toward more declarative ingestion and lakehouse-native processing
6. Prepare the Gold layer and semantic models for Direct Lake adoption
7. Evolve from AI-assisted development toward AI-agent development.
## Final thoughts
For us, the central lesson of this project is that Fabric is most valuable when it helps a small team stay focused on business problems. That only happens if you make the right choices. For us it meant ingesting with shortcuts and mirroring wherever possible, choosing our engine and development workflow early (because a warehouse-first/T-SQL implementation will look very different from a Spark-centric one), pushing the platform toward declarative patterns so engineers spend more time specifying *what* should happen than hand-coding every detail, and keeping the workspace architecture much simpler than our first instinct suggested. It also meant leaning code-first rather than assuming low-code is automatically the easiest path; in the era of AI coding assistants and agent-based workflows, adopting practices from software engineering creates more leverage than living in low-code tools.
Just as importantly, we had to keep learning from others (shoutout [r/MicrosoftFabric](https://www.reddit.com/r/MicrosoftFabric/)), compare ourselves against other implementations, stay willing to make deep changes, and always stay learning. Fabric is evolving so quickly that patience is often an advantage: you can let the early adopters discover the sharp edges, then jump in when things are mature enough. If there is a single throughline in everything above, it is this: keep asking how the technology can get out of the way so your team can move faster on the work that actually matters.
Our data platform would not exist without the hard work, support, and candid feedback of an entire team. I especially want to thank **Mark Behne** and **Bob Buttrick**, whose work as Analytics Engineers has shaped the platform at every stage, and our CIO **Ketan Palicha** for creating the space for us to build solutions.